
How to query your Xero data from Google Sheets
Xero is a sophisticated and comprehensive cloud-based accounting platform. For many, the built-in reports and analysis that Xero offers is enough for our day-to-day needs. However, if you need something a little more customized, or you need to aggregate your data over multiple Xero accounts, or you need to cross-reference your Xero data with other cloud services, then you’re going to have to build it yourself. And what better way than using the tool you’re already familiar with - Google Sheets.
In this article, I’ll take you through the steps to connect Google Sheets to your Xero data, and get started customizing the reports you need.
First - grab your SyncHub Credentials
If you don’t already have a SyncHub account, you can grab a free trial here - go on, I’ll wait - it only takes a minute and you can cancel as soon as you’ve finished this tutorial if you like.
Ready? Now, a quick reminder - SyncHub works by staging your Xero data in a relational database. This gives us a huge advantage over other connectors which query the Xero API directly, but I won’t go in to them here (check this blog post if you need convincing). The point is, once you have connected your Xero account, querying from Google Sheets is trivial as you are just using it’s native JDBC Connector.
So, once you’re connected, go to your SyncHub Dashboard and grab your new database credentials:


As you can see, there are four main parts to your connection - the server and database, and the username/password. You’ll need them all for the next parts.
Reading your Xero data from Google Sheets
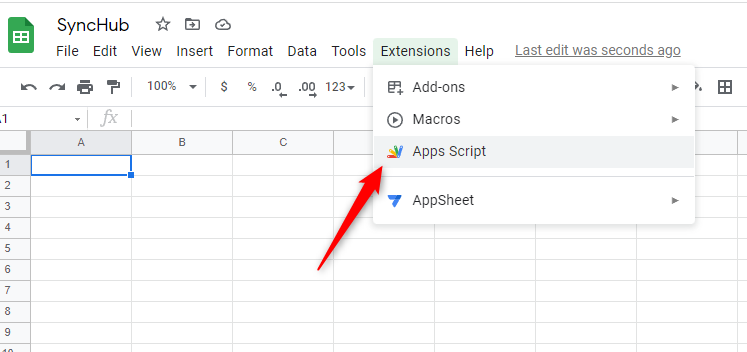
We now just need to tell Google Sheets where to find your data, and for this we use the built-in JDBC connector via a customized Apps Script. Visit the Extensions -> Apps Script menu:
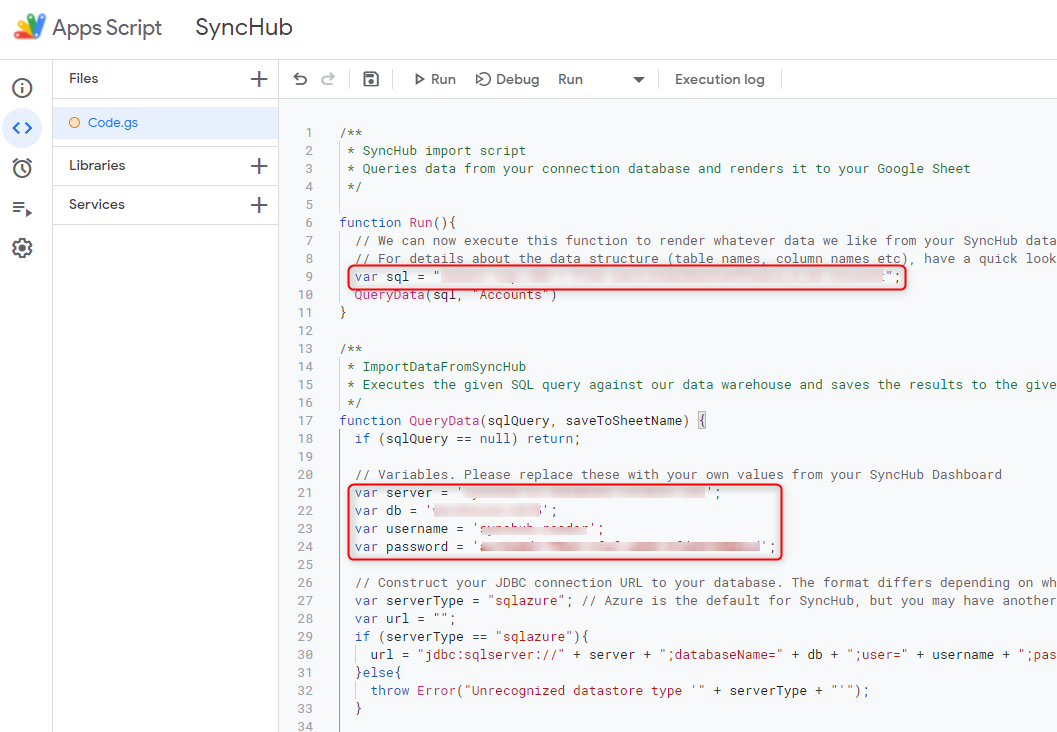
The script editor will open with a default template. Delete everything you see, and replace with the following, taking special note to replace the information with data from your connection above:
/**
 * SyncHub import script
 * Queries data from your connection database and renders it to your Google Sheet
 */

function Run(){
  // We can now execute this function to render whatever data we like from your SyncHub datastore.
  // For details about the data structure (table names, column names etc), have a quick look at our Data Model Explorer - https://app.synchub.io/explore
  var sql = "select top 100 * from [YOUR_SCHEMA_NAME].[YOUR_TABLE_NAME]"
  QueryData(sql, "Accounts")
}

/**
 * ImportDataFromSyncHub
 * Executes the given SQL query against our data warehouse and saves the results to the given sheet
 */
function QueryData(sqlQuery, saveToSheetName) {
  if (sqlQuery == null) return;

  // Variables. Please replace these with your own values from your SyncHub Dashboard
  var server = '[YOUR_SERVER_NAME]';
  var db = '[YOUR_DATABASE_NAME]';
  var username = '[YOUR_USER_NAME]';
  var password = '[YOUR_PASSWORD]';

  // Construct your JDBC connection URL to your database. The format differs depending on what type of data store you are using
  var serverType = "sqlazure"; // Azure is the default for SyncHub, but you may have another data store hosted offsite
  var url = "";
  if (serverType == "sqlazure"){
    url = "jdbc:sqlserver://" + server + ";databaseName=" + db + ";user=" + username + ";password=" + password;
  }else{
    throw Error("Unrecognized datastore type '" + serverType + "'");
  }

  // Find (or create) the sheet that we want to save this info to, and prepare/clear it
  var spreadsheet = SpreadsheetApp.getActive();
  var sheet = spreadsheet.getSheetByName(saveToSheetName);
  if (sheet == null) sheet = spreadsheet.insertSheet(saveToSheetName);
  sheet.clearContents();

  // Now, create your connection
  var conn = Jdbc.getConnection(url);
  var stmt = conn.createStatement();

  // Load our data
  Logger.log("Querying: " + sqlQuery);
  var results = stmt.executeQuery(sqlQuery);

  // We use the metaData property to detect the column names, then render them across the top of the sheet
  Logger.log("Rendering column headers");
  var row = [];
  var metaData=results.getMetaData();
  var numCols = metaData.getColumnCount();
  for (var col = 0; col < numCols; col++) {
    row.push(metaData.getColumnName(col + 1));
  }
  sheet.appendRow(row);

  // Now, we render each result in it's own row
  Logger.log("Rendering data");
  while (results.next()) {
    row = [];
    for (var col = 0; col < numCols; col++) {
      row.push(results.getString(col + 1));
    }
    sheet.appendRow(row);
  }

  // Clean up our connections
  Logger.log("Cleaning up");
  results.close();
  stmt.close();
  conn.close();
}


// Kick everything off
Run();
Important: Don’t forget to update the script above with the database credentials you grabbed earlier from your SyncHub dashboard.
The final script should look a little something like this (we have highlighted the portions which you need to replace with your own data:
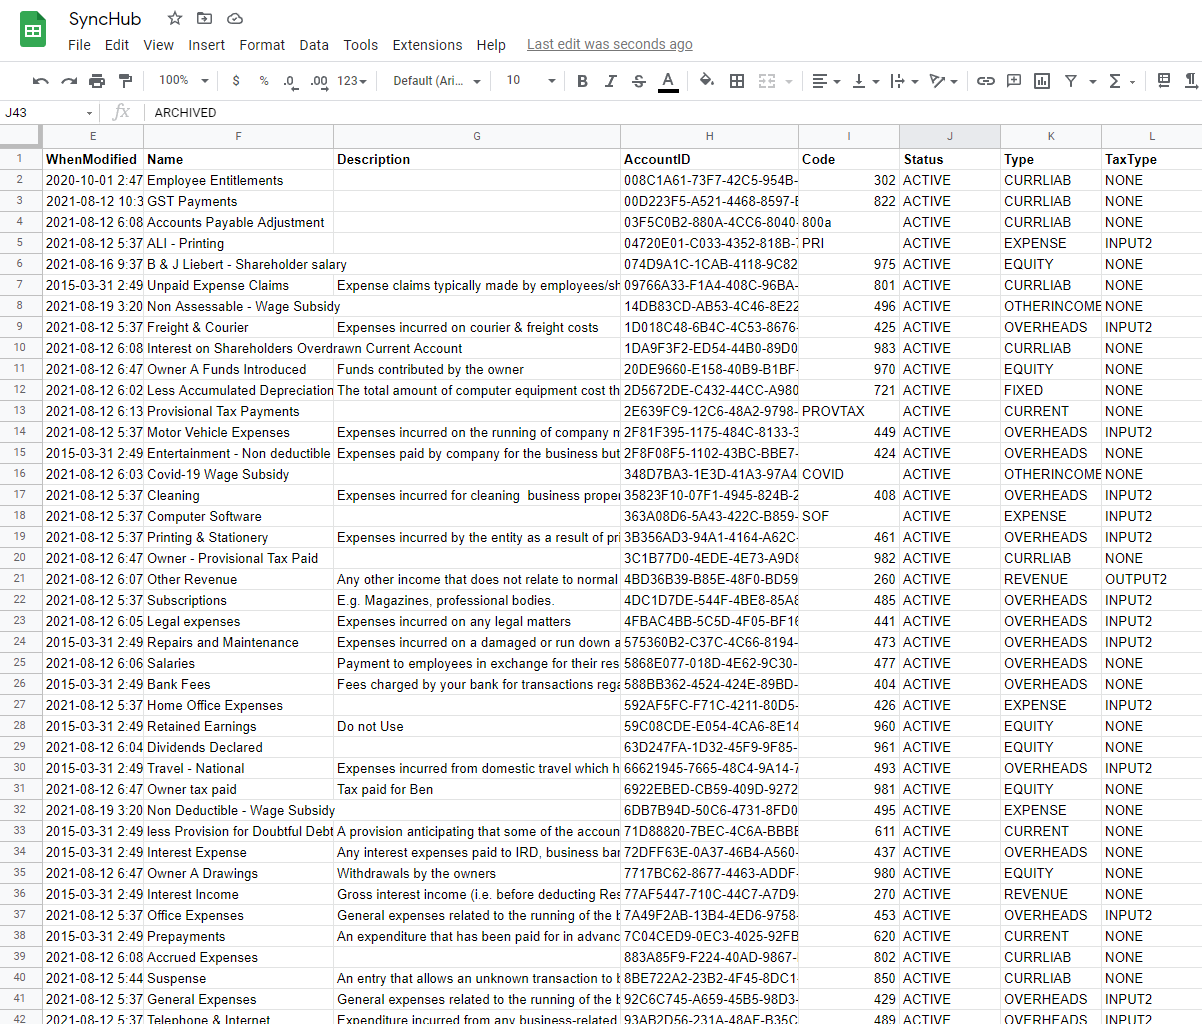
Now, just hit the Save, then the Run buttons. You’ll be prompted to authorize the Apps Script, and then….voila - your Sheet will be populated with the data from your query:
Efficiently downloading complex queries
Rather than building complex queries in your script, you can use our Insights module. Insights allows you to pre-calculate complex queries and store them in a dedicated database table, which is highly performant.
Creating Xero reports in Google Sheets
From here, it’s easy. Just use your regular Google Sheets skills to slice and dice the data as required for your reports. You can bring in multiple tables into different tabs, or if you modify our script, you can even dump your Xero data inline on a specific sheet.
As you can see, Google Sheets does all the heavy lifting for you - all you need is the right data in the first place. With SyncHub, you can pull down information from different tables and join according to our data model. For example, you might build a report to show Payments by Customer, just by using lookups between the Payments table and the Invoice table, and then to the Customer table. With the raw data provided by SyncHub, your options are almost unlimited.
Keeping your data up-to-date
SyncHub updates it’s staged data from Xero in near-realtime, so it’s always available. However the script above will only update your Google Sheet when it is executed. You can either run the script on-demand, as required, or with a minor addition, you can have it run for you automatically - this keeping your Google Sheets reports up to date with realtime data.
To add automatic updates, simply add this to the bottom of your script:
ScriptApp.newTrigger('Run')
.timeBased()
.everyMinutes(1440)
.create()
Beyond Xero
Xero-specific reports are essential, but the true power of SyncHub comes when you augment your Xero data with additional information:
SyncHub allows you to pull in data from multiple Xero accounts, and compare/report/aggregate from within the same Google Sheet
Most businesses use multiple cloud platforms. SyncHub provides connectors to a wide range of popular cloud platforms - Deputy, Tanda, Unleashed, Pipedrive, Teamwork, simPRO, Wrike….and many many more. Imagine the insights you could gather by consolidating this information into a single dashboard (or see this case study for real-world examples).
So what are you waiting for? Grab a free trial of SyncHub here and see what you can do. In ten minutes from now, you could be reporting against your Xero data and taking your first steps towards a data-driven business.